Decision Graphics: Simple Tools to Improve Audit Decision-making

by Loren Yager and Paul Francis, U.S. Government Accountability Office’s Center for Audit Excellence
Making informed planning decisions early in the audit process is key to completing audits in a timely manner. Many teams use historical information to determine how long an audit will take. But every audit and every audit organization is different, so it is impossible to create schedules and guidelines from past experiences that can be applied to all situations. A few simple graphics can enable audit teams to have more in-depth discussions at an earlier stage and confront some of the difficulties and challenges that often cause problems later in the audit. These decision tools can also facilitate communication with stakeholders and leadership in the organization, enabling them to quickly assess and contribute to audit planning as well as make decisions regarding resources.
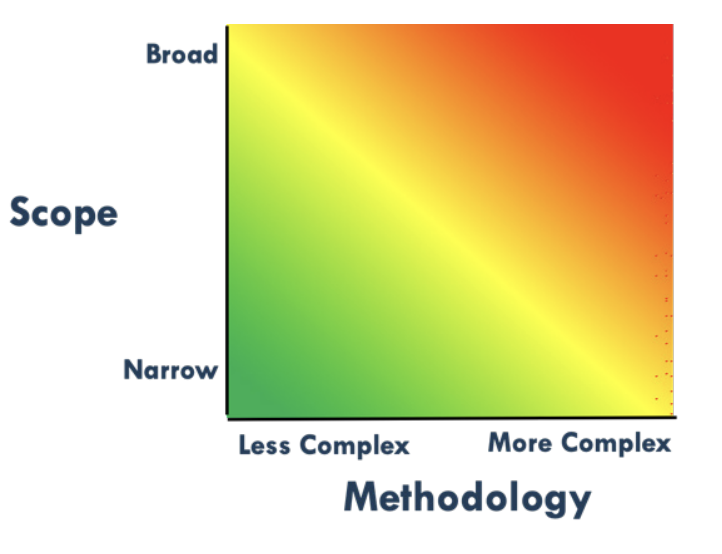
The “heat map” (figure 1) can help teams quickly and proactively assess the complexity of an audit along the two dimensions of scope and methodology. On the left-hand side are factors that affect an audit’s scope, and on the right-hand side, factors that affect an audit’s methodological complexity.
Scope Factors:
- Program scale/dollar value
- Program complexity
- Evaluative vs/ descriptive
- Number of decision-makers
- Number of organizations
- Number of locations
- Number of years
- Unit(s) of analysis
Methodology Factors:
- Prior audits on issue
- Level of cooperation with audited agency
- Evaluative vs/ descriptive
- Applicable criteria
- Known database(s)
- Primary evidence/fieldwork
- Collection/selection methods
- Number of objectives
- Extent of travel
- -Unit(s) of analysis
For example, an audit on the use and abuse of official charge cards ticks off just about all the boxes in the green zone: clear rules (criteria), excellent data, many prior audits, no travel required, etc. In contrast, a proposed first-time audit on a special immigration program that involves multiple locations around the world, few if any reliable data sources, multiple organizations, and lack of cooperation with the audited agency would likely fall in the red zone.
Using this list of factors enables teams to quickly assess the complexity of the potential audit and begin planning with an appropriate balance of resources and awareness of audit impact. Teams can also use the heat map throughout the audit process by revisiting the audit’s objectives to see if the audit is either too ambitious (too far in the red zone) or insufficiently impactful (too far in the green zone).
Many of the factors that affect complexity would eventually become clear over the course of an audit, but the advantage of having this discussion early is that the team and stakeholders can begin to address those factors and make decisions at an early stage, to ensure they use resources wisely.
A second simple graphic that can help teams make decisions is the “arrow chart” (figure 2), which illustrates the significant differences between a general audit area and a very specific unit of analysis.
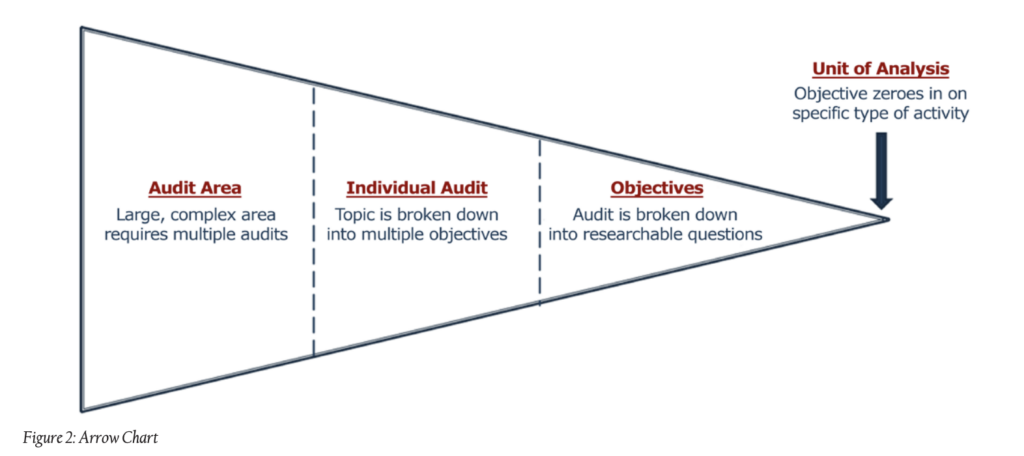
For example, many nations have a variety of food assistance programs, some of which are designed to address emergency needs, while others are linked to education or other sectors. In addition, some of these programs provide bulk food to the nation, some involve purchasing food in the region, and others provide cash or vouchers directly to recipients. Food assistance is therefore an “audit area” far too broad to be addressed in a single audit.
An audit team can use the arrow chart to make tough decisions about what aspects of the program to examine, and ultimately, about the specific “unit of analysis,” which might be transportation costs, quality of oversight, the time required for delivery, nutritional benefits, or losses due to theft or spoilage. As in the case of the heat map, the arrow chart helps generate conversations and awareness of the big picture early. The payoff is audits that are appropriately scoped and delivered closer to the planned schedule.
One of the most difficult decisions that auditors have to make is to determine the correct criteria to apply to the program or activity under review. A third graphic, the “criteria continuum,” enables the audit team to recognize some of the options it has for criteria, and how the criteria it selects could affect the audit (figure 3).
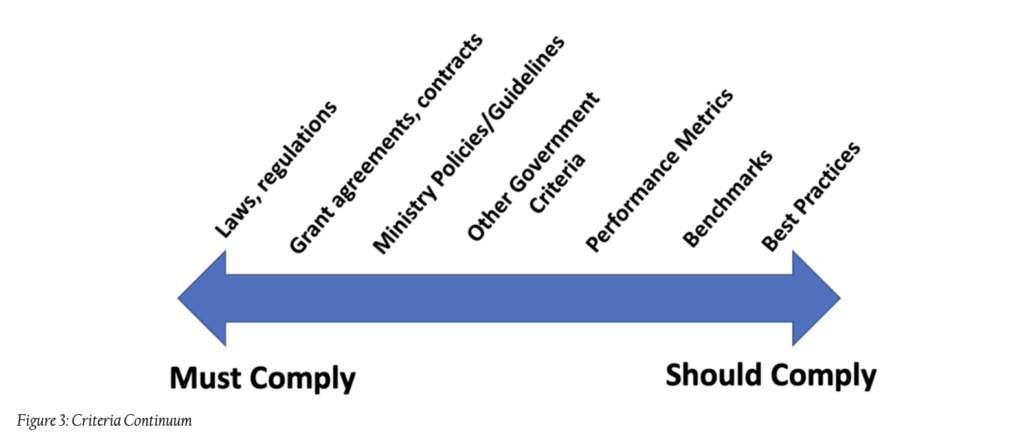
In some cases, the program or activity may be guided by specific laws and regulations, which agencies cannot easily claim they are not required to follow. Sometimes, however, the language is too general to serve as an ideal source of criteria. If this is the case, then audit teams will have to decide whether there are agency guidelines, performance metrics, or other standards they can use.
Each source of criteria has its own consequences. In particular, some of the criteria on the right-hand side of the continuum are not considered “hard criteria,” so the agency or program officials may not accept recommendations based on those standards and the audit will have little impact. Nevertheless, these types of criteria are important to audits of program effectiveness.
For example, while a water project must comply with laws and regulations, doing so does not necessarily mean that the program is having the desired effect. The audit team would need other criteria, such as benchmarks and performance metrics, to assess effectiveness.
Conclusion
Planning bias is a common problem, as audit teams are nearly always optimistic about their ability to complete the audit within a set period of time. The simple graphics discussed above can guide thoughtful discussions and inform decisions at an early stage in the audit planning process, thereby reducing false starts and ineffective efforts, which are frustrating for the team and costly for the audit organization.
Moreover, these graphics are quite easy to learn and apply, so only a small investment is needed to increase the impact of the work of Supreme Audit Institutions and other audit organizations.
Cover image: bagotaj/stock.adobe.com