Open Data and AI-Driven Geospatial Analysis: Scaling Risk Assessment of Post-Flood Emergency Grants to the Full Population

Author: Joaquín Izquierdo Peris, Audit Senior, Sindicatura de Comptes de la Comunitat Valenciana (Regional Audit Institution, Valencia, Spain)
Abstract
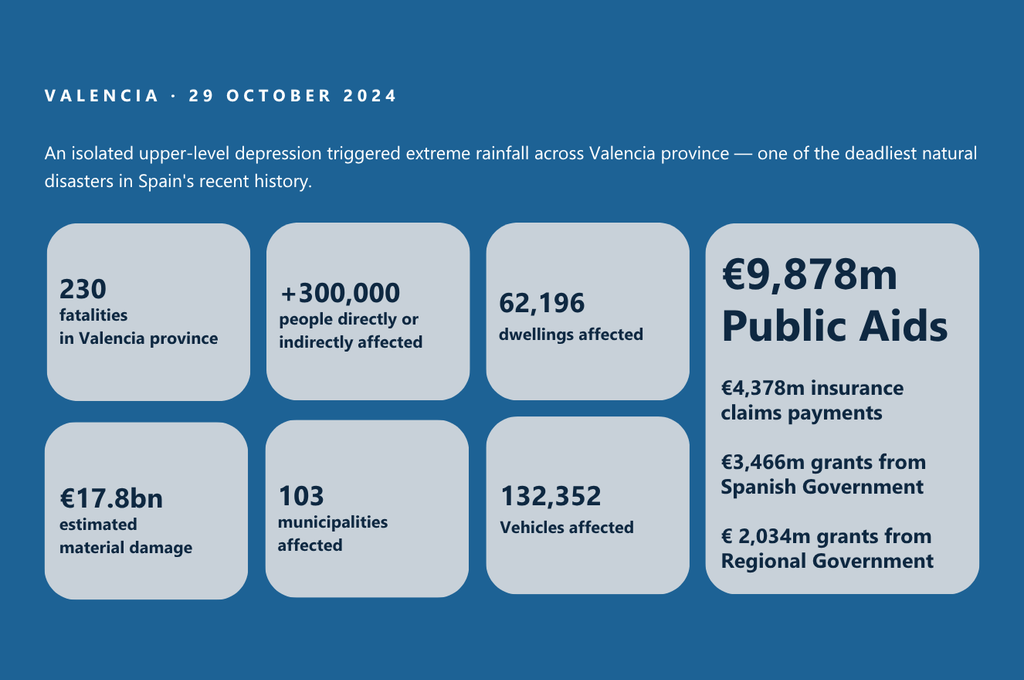
On 29 October 2024, a DANA — a Spanish acronym for an isolated upper-level atmospheric depression forming over the Mediterranean Sea — triggered catastrophic flash flooding across Valencia province, Spain. Within hours, several municipalities received severe rainfall equivalent to an entire year’s precipitation, with peaks of up to 771 litres per square metre, devastating entire towns, leaving thousands stranded, damaging over 60,000 dwellings, destroying more than 130,000 vehicles, and claiming 230 lives.
Within weeks, the Regional Government deployed a comprehensive post-disaster aid framework exceeding 2,000 million euros as of March 2026, including a direct grant programme (“Aid for essential household goods”) to compensate affected households for the loss of essential items in their primary dwelling. To examine all 27,282 applications under such a concession model, the Regional Audit Institution of Valencia designed an automated methodology integrating open data, geospatial analysis, Python scripting, and artificial intelligence (AI)-assisted drafting — enabling individual-level assessment without recourse to sampling.
1. Background and Audit Mandate
Following the DANA flooding of October 2024, the deadliest natural disaster in Spain in recent history, the Regional Government issued direct grants of up to 9,000 euros to owners and tenants of affected dwellings to compensate for the loss of household appliances and other essential domestic items. Grants were conceded without prior assessment, solely on the basis of a responsible declaration signed by the applicant attesting that essential household items at their primary residence had been damaged as a result of the flooding — a design that placed the full evidentiary burden on the applicant and created a high-risk scenario from a control perspective, precisely of the type that INTOSAI’s GUID 53301 identifies as characteristic of post-disaster aid contexts.
The Sindicatura de Comptes de la Comunitat Valenciana2, has undertaken a special audit report combining compliance and performance approaches to assess whether the aid reached its intended purposes.
The audit frames a central analytical question: to what extent do the geographic characteristics of the primary dwelling declared by each applicant provide objective, publicly verifiable indicators consistent or inconsistent with the programme’s essential eligibility condition — that essential household items at that address had in fact been damaged because of the flooding event?
The spatial audit procedure described in this article identified a substantial number of funded applications presenting geographic indicators inconsistent with the programme’s eligibility condition, which the granting entity will need to subject to individual documentary review to determine whether the declared damage can be substantiated. The audit team discussed these preliminary findings with responsible personnel of the granting entity. The complete and final report on the audit of aid related to the DANA was published on 15 September 2026, and is available on the Sindicatura de Comptes website (in Spanish)3.
2. Beyond Sampling: a Full-Population Audit Approach
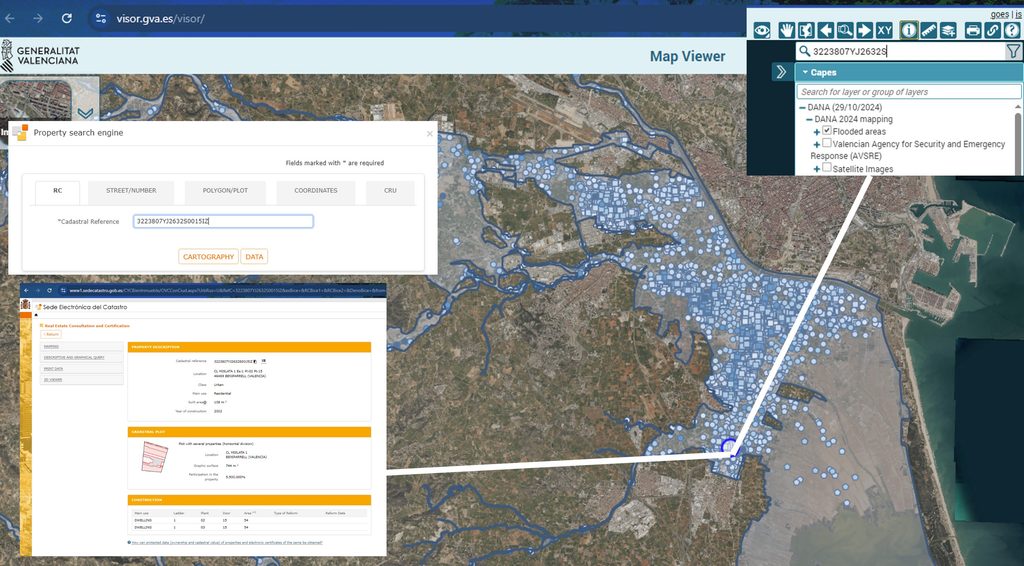
Prior to the development of the automated pipeline, the spatial verification of a funded application required the auditor to manually query each cadastral reference, a comprehensive recording of real estate or real property’s boundaries, through the Valencian Government’s cartographic viewer4, cross-referencing the location of the declared property against the official DANA flood footprint layer, and simultaneously consulting the Cadastre Electronic Register for the property’s descriptive and constructive data. This manual procedure — illustrated in Figure 1 — is accurate and reliable for individual case review, but its sequential, one-by-one nature renders it wholly impractical at the scale of 27,282 applications: assuming a conservative estimate of five minutes per case, full-population coverage would require over 2,200 hours of auditor time.
Conventional audit practice would have restricted spatial analysis to a stratified sample — typically 200 to 400 cases — with findings extrapolated statistically. The availability of complete, machine-readable public datasets fundamentally altered the cost-benefit calculus of this choice.
The availability of both mentioned datasets was a necessary but not sufficient condition: transforming them into a population-level audit procedure required a Geographic Information System (GIS)-based analytical environment, Python scripting to automate the processing of 27,282 records, and AI-assisted drafting to support the iterative development of the analytical pipeline.
The flood footprint5 is a georeferenced vector layer delineating the area affected by surface water inundation on 29 October 2024, produced by the Valencian Cartographic Institute (ICV/GVA) through the processing of satellite imagery and aerial photography captured in the immediate aftermath of the event, and published as open data.
The Cadastre Electronic Register6 of the Directorate-General of Cadastre (Spanish central government) provides free public access to cadastral data. Available resources include alphanumeric property records and vector parcel cartography downloadable by province, as well as web services for individual and bulk queries of non-protected cadastral attributes — including use classification, floor-level data, and built surface area — for every registered property.
The audit procedure described in the following section does not purport to establish the presence or absence of damage in individual cases; rather, it constitutes a GIS-based data analytics procedure consistent with the risk-based approach recommended in GUID 5330, generating objective, publicly verifiable audit leads for prioritised documentary follow-up.
3. Methodological Procedure
Using QGIS7 and its embedded Python console, the audit team built a suite of automated scripts that processed the full 27,282-record population end-to-end across seven sequential stages.
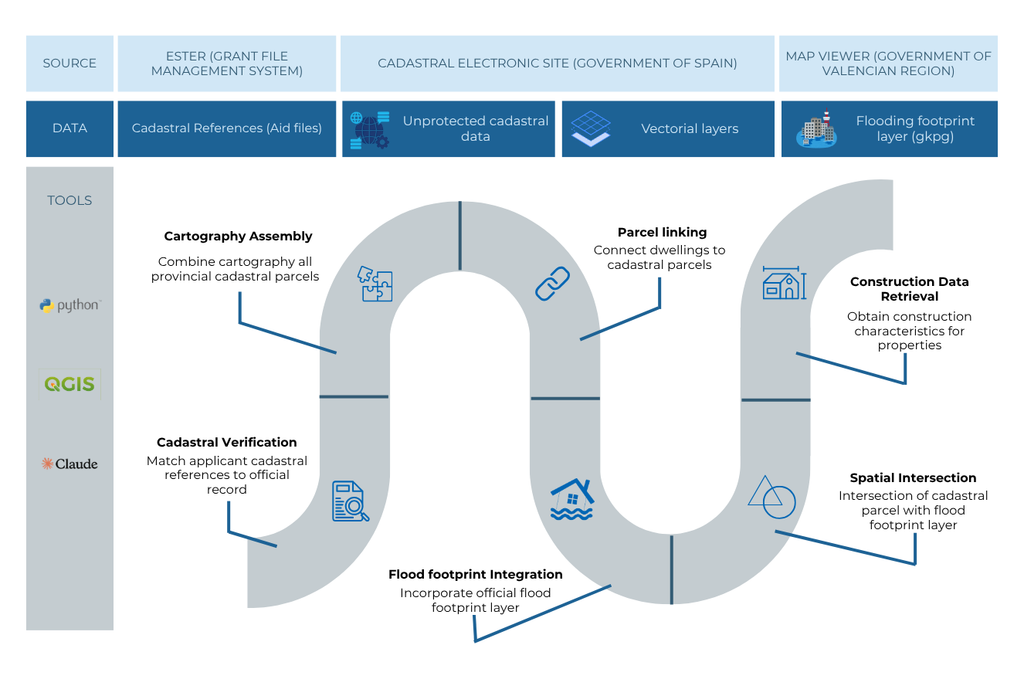
The first stage verified whether each cadastral reference declared by the applicant corresponded to a property registered in the Directorate-General of Cadastre, querying the Cadastre’s public data web service for all 27,282 references. The script configured a two-second pause between queries to prevent server-side throttling, with automatic detection of blocked responses and up to three retry attempts per reference.
The second stage assembled the provincial cadastral cartography. The script downloaded parcel geometries for the entire province of Valencia from the Cadastre Electronic Register, aggregated them into a single layer across all 266 municipalities, and applied geometry repair. The resulting layer comprises over 1.7 million georeferenced parcels.
The third stage linked each granted dwelling — identified by its cadastral reference — to the geometry of its corresponding cadastral parcel. The script implemented a one-to-many join to avoid data loss in multi-property buildings, where multiple cadastral references share a single parcel identifier.
The fourth stage incorporated the official flood footprint layer published by the Valencian Cartographic Institute (ICV/GVA). The script loaded the layer and applied geometry repair prior to use in the spatial analysis.
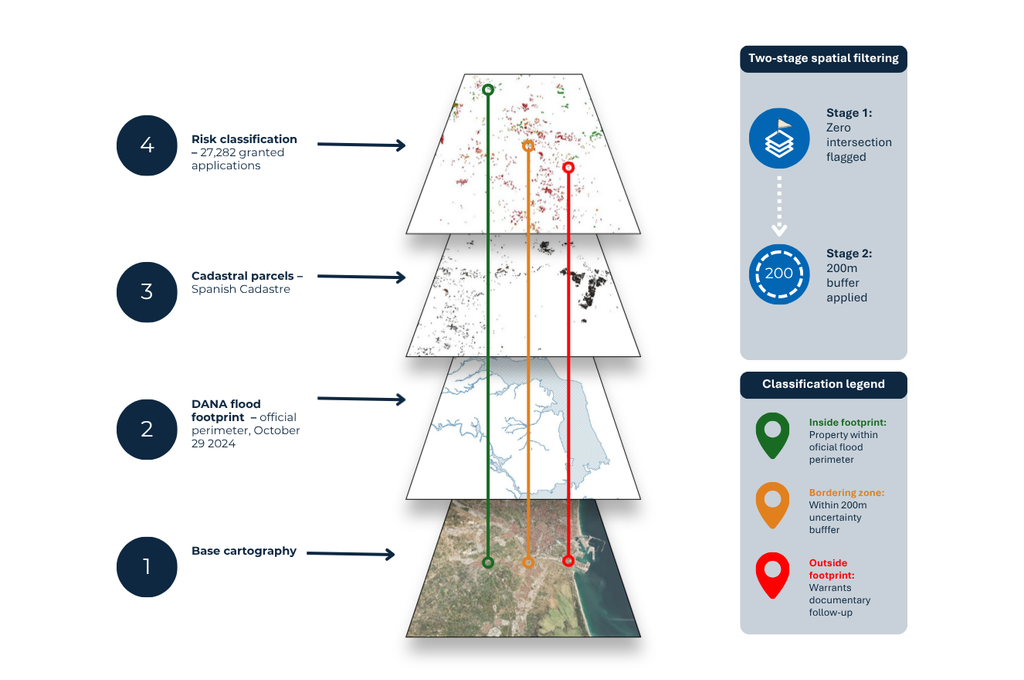
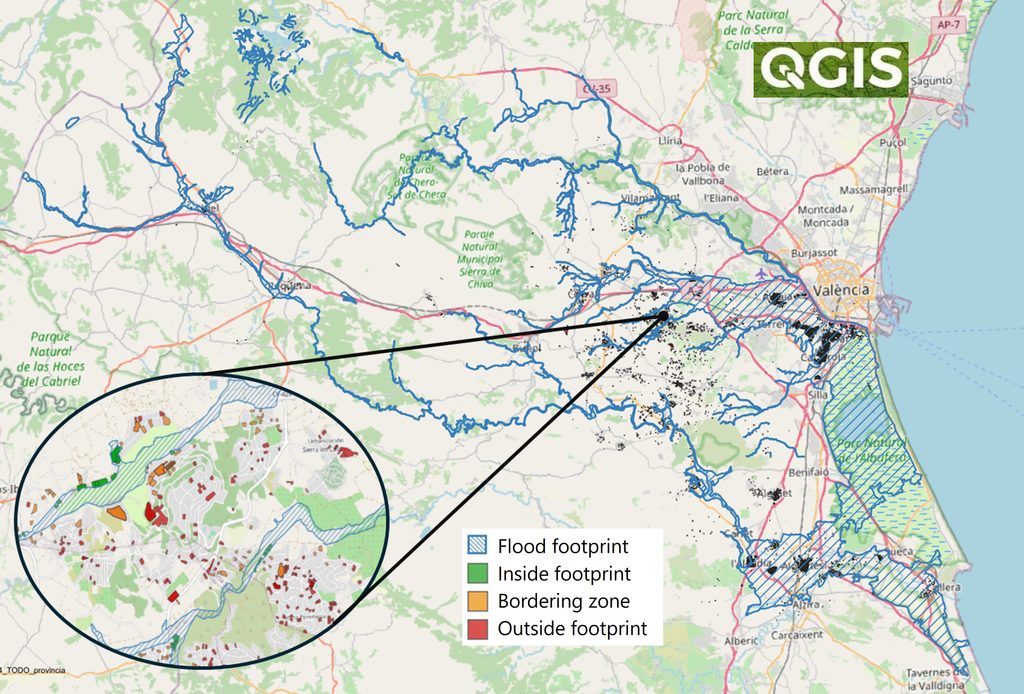
The fifth and central stage performed the spatial intersection analysis. For each application, the script assessed whether the cadastral parcel polygon intersected the flood footprint polygon; any spatial overlap, however small, resulted in classification as inside the footprint. In keeping with a conservative methodological approach, the script generated a 200-metre buffer around the perimeter of the footprint to identify a proximate zone, classifying parcels within this band separately from those clearly beyond it.
The sixth stage retrieved construction characteristics — use classification, floor code, and built surface area — for each declared property through automated queries to the Cadastre web service.
A final consolidation stage assembled all results into a master table and produced the georeferenced output layer with three-tier colour classification — green for parcels inside the flood perimeter, orange for the proximate zone, and red for parcels located more than two hundred metres outside.
4. Open Data, Automation, and AI-Assisted Drafting
The entire analytical chain relied on publicly available datasets — the flood perimeter and the national cadastral registry — both open government sources subject to no access restrictions and freely replicable by any third party with access to the same public data, without requiring specialised data infrastructure.
Python scripting within QGIS’s embedded interpreter automated the full pipeline from raw input files to risk-classified output tables and cartographic layers, with no manual data manipulation at any intermediate stage. The audit team used an AI large language model (Claude, Anthropic) under a documented internal procedure to support iterative script drafting, troubleshooting of automated scripts, methodological note preparation, and report text structuring.
The AI’s contribution was strictly assistive and subject to review at each iteration: the audit team performed all methodological decisions, threshold calibration, data validation, and findings interpretation exclusively.
5. Implications for Public Audit Practice
This case demonstrates that open geodata, GIS automation, and AI-assisted drafting can transform audit evidence from sample-based inference to population-level fact-finding — even under the resource constraints typical of regional audit institutions. The key enabling factors were not exceptional technology budgets but the availability of structured public datasets and the willingness to invest in bespoke scripting as an audit procedure.
Three design principles proved transferable beyond this case: conservative spatial thresholds protect findings from overreaching the probatory value of geodata; transparent, versioned analytical code creates an auditable trail that can be reviewed and updated without rerunning the full analysis; and framing location as a risk indicator — rather than a definitive criterion — preserves the proportionality required by INTOSAI standards. Any SAI with access to open cadastral and hazard-perimeter data can replicate this approach for natural disaster grants, flood relief, post-earthquake reconstruction, or wildfire recovery funds using open-source GIS tools at no additional cost.
For further information, please contact author by email: jizquierdo@sindicom.es
Footnotes
- INTOSAI, GUID 5330: Guidance on Auditing Disaster Management (Vienna: INTOSAI, 2020), https://www.issai.org/wp-content/uploads/2020/12/GUID-5330-Guidance-on-Auditing-Disaster-Management.pdf ↩︎
- Regional Audit Institution of Valencia: https://www.sindicom.es/portada ↩︎
- Available at https://www.sindicom.es/informe-especial-subvenciones-dana-sector-autonomico-ejercicios-2024-y-2025 ↩︎
- Available at https://visor.gva.es/visor/ ↩︎
- Available at https://geocataleg.gva.es/#/search?uuid=spaicv0701_dana24_huella_inundacion&lang=spa ↩︎
- Available at https://www.sedecatastro.gob.es/Accesos/SECAccDescargaDatos.aspx ↩︎
- QGIS is an open-source Geographic Information System (GIS) application that enables the loading of geographic data, the overlaying of spatial data layers, the measurement and intersection of geometries, and the visualisation of results on a cartographic base. Available at https://qgis.org/ ↩︎
Note: The author utilized AI assistance in developing formatting concepts for Figures 3 and 4, but the final figures are not AI generated.