Using Geographic Information Systems

Audit Techniques to Detect Occupation-Without-Permission Structures in National and Public-Owned Land
by Songweon Lee, Audit and Inspection Research Institute, The Board of Audit and Inspection of Korea; Yong Huh, Spatial Information Research Institute, Korea Land and Geospatial Informatix Corporation; Jinwon Ho, Audit and Inspection Research Institute, The Board of Audit and Inspection of Korea; Ho Shim, Audit and Inspection Research Institute, The Board of Audit and Inspection of Korea
With the spread of Information Technology (IT) in government activities, Supreme Audit Institutions (SAIs) have been increasingly implementing Computer Assisted Auditing Techniques (CAATs). Among the CAATs, Geographic Information System (GIS), which can depict, overlay and analyze geospatial information based on location, can be of value for every step of audit.
The GIS can efficiently depict and analyze attribute data, as well as image information. Furthermore, many central and local governments have recently begun using geospatial information to conduct their work more efficiently. For example, the Korean government invested an estimated 1.3 billion U.S. dollars to develop and maintain National Geospatial Information Systems (NGIS) to support their efforts from 2008 to 2012.
This article presents an overview of how GIS, using geospatial data, assists auditing by detecting Occupation Without Permission (OWP) buildings and vinyl greenhouses in Korea’s National and Public-Owned Land (NPOL).
Background
There have been many criticisms that the NPOL, which occupies 32.4 percent of lands across the whole extent of Korea, has been poorly managed. There have also been complaints about excessive auditing in terms of frequency and intensity, and a strong demand for IT-based audit. Therefore, this research focuses on developing the audit model utilizing GIS to overcome spatiotemporal barriers and to work toward minimizing the resistance of auditees.
Among the various models that can be used in NPOL management-related audits, this research specifies the detailed procedure of how OWP in the NPOL can be detected, as OWP has been considered to be the main problem in the NPOL management in Korea.
Moreover, after developing and applying the models in real life scenarios, public officials in charge of managing NPOL in the local governments checked the accuracy of developed models to learn how reliable these models would be in auditing.
The regional scope of this research is composed of three cities in Gyeonggi Province. Suwon (area: 121km2), the capital of Gyeonggi Province, contains urban characteristics, while Goyang (area: 268km2) has combined characteristics of urban and rural regions. Yeoju (area: 608km2) is characterized by rural and mountainous regions. With respect to time, the various spatial and NPOL-related administration data were collected in early 2014.
Figure 1 shows the locations of the three cities, along with Gyeonggi Province, in Korea.
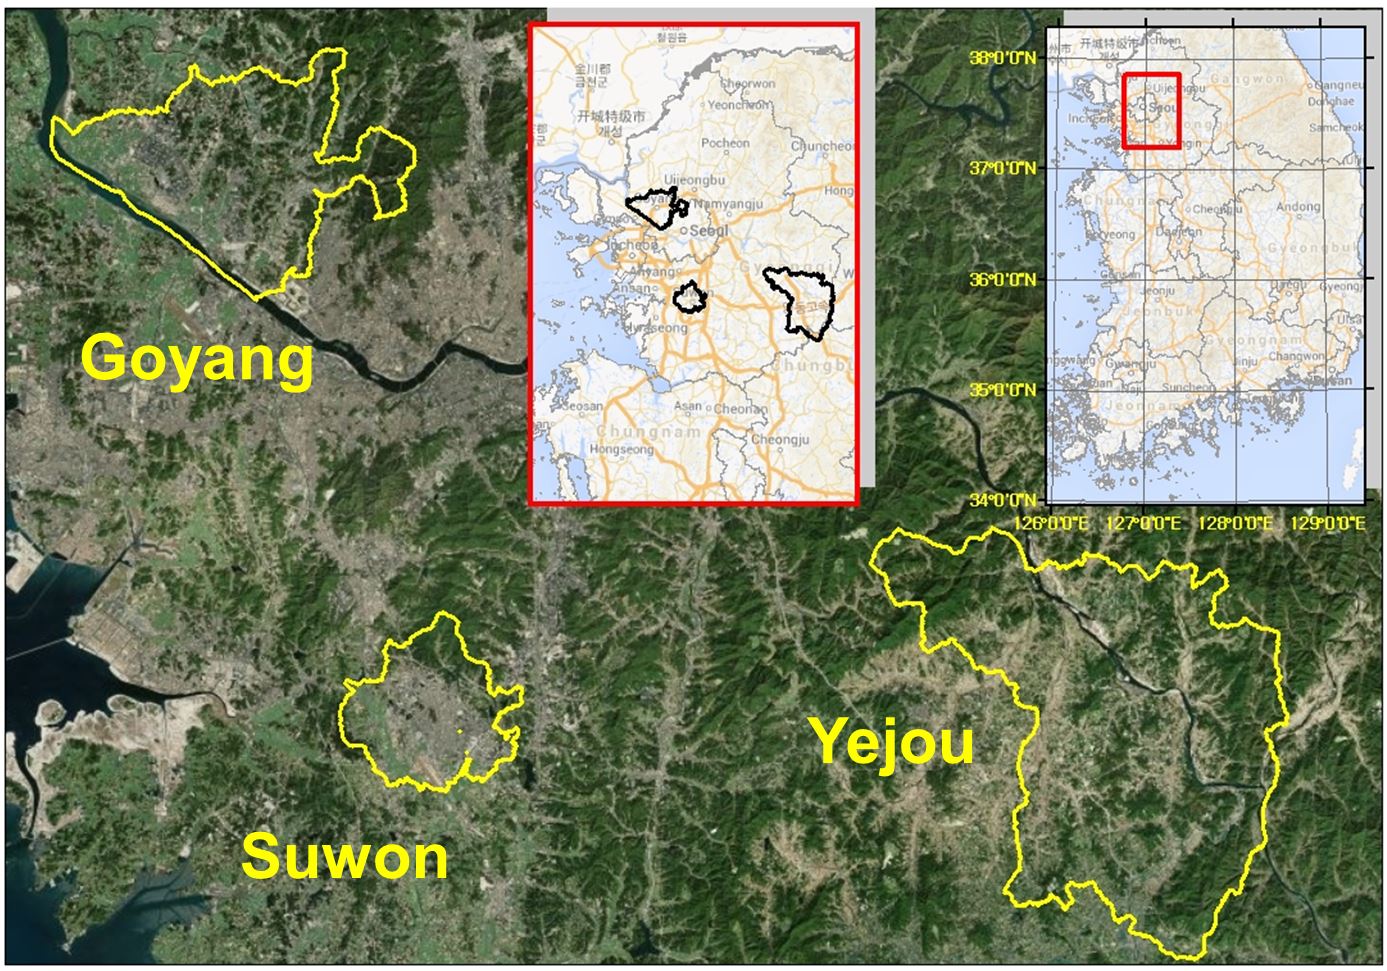
Figure 1: Location of the Three CitiesThere are a total 146,584 NPOL parcels in the three cities, with 60,477 NPOL parcels being in Yeoju, 50,324 in Goyang and 35,783 in Suwon. The average area of NPOL parcels is similar among the three cities, and in the respect of Individual Public Notification Price of Land (IPNPL), the price of NPOL parcels in Suwon is the highest. Table 1 shows the main characteristics of NPOL parcels in the three cities.
Notice:
While ‘total’ refers to the sum of the three cities in the ‘Number of NPOL parcels’, in the case of ‘Average area of NPOL parcels’ and ‘Average price of IPNPL, ‘total’ means the average of the three cities.
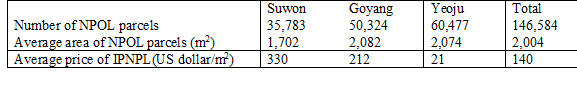
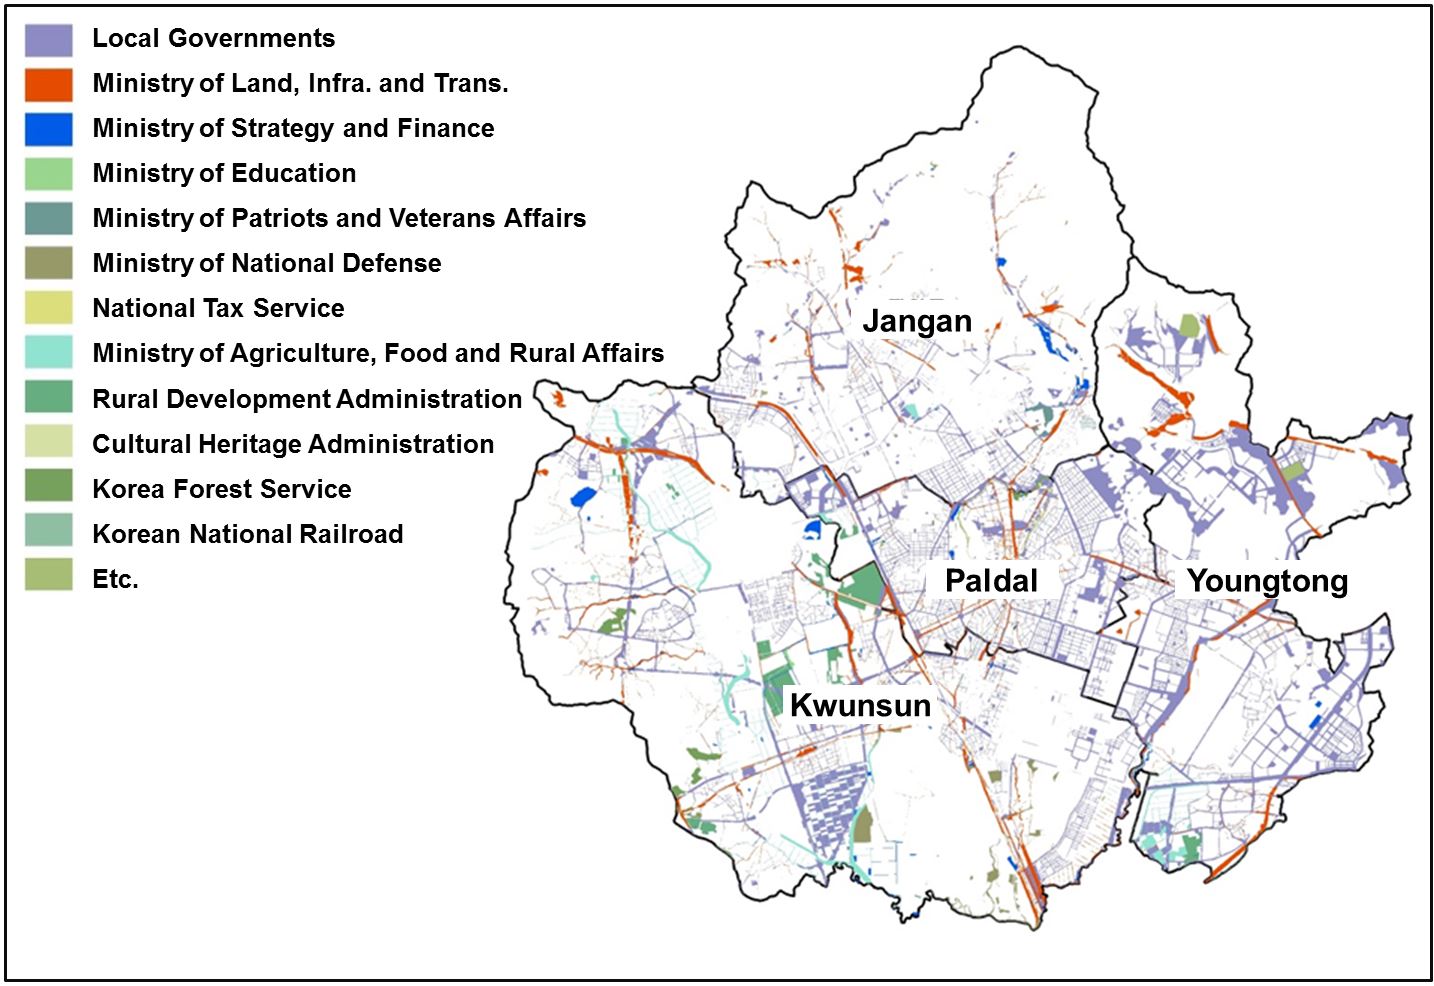
In respect of ownership based on organization, the Ministry of Land, Infrastructure and Transport (MLIT) occupies 31 percent of the total NPOL parcels; the three local governments, in total, have 43.8 percent. Table 2 shows the present conditions of possession based on the organization, which has over 1,000 NPOL parcels, and Figure 2 shows the distribution of NPOL parcels based on the ownership in Suwon.

1 Ministry of Agriculture, Food and Rural Affairs
2 Ministry of Strategy and Finance
3 Ministry of National Defense
4 Korea Forest Service
Data and Methodology
Data
The data can be divided into spatial and public administrative data. Spatial data is composed of orthophotos (51cm resolution), serial cadastral digital maps containing information of the cadastral number, area, and other factors, and digital maps, which contain information such as the characteristics of buildings and roads.
Meanwhile, public administrative data is composed of the NPOL management register based on the cadastral number, ownership, area, land category, and information about whether the government imposes dues and charges for compelling compliance when illegal activities for each NPOL parcel are conducted. Additionally, the Sae-Um-Tur system, which maintains information about almost all the buildings in Korea, was used to get information about public buildings and their ownership.
Methodology
To detect OWP in NPOL parcels, this article focuses on two main representative structures: buildings and vinyl greenhouses.
Building
The NPOL serial cadastral digital map, shown in Figure 1, was initially created using a cadastral number, which commonly exists in the serial cadastral digital map and management register. Then, a documentarily-used NPOL serial cadastral digital map was made, which shows the location on which occupation permission, dues, charges, etc., are imposed.
After making a documentarily-used NPOL serial cadastral digital map, a documentarily-unused NPOL serial cadastral digital map was created by eliminating the NPOL parcels of the documentarily-used NPOL serial cadastral digital map from those of the NPOL serial cadastral digital map. Figure 3 shows the documentarily-unused NPOL serial cadastral digital map of Suwon.
The building layer of the digital map was then laid over the documentarily-unused NPOL serial cadastral digital map, and if the center of a building is located inside the NPOL parcel of a documentarily-unused NPOL serial cadastral digital map, it was assumed that the building could be considered an OWP building.
However, when checking for the model’s fit by applying it to real life, various phenomena which had not been previously anticipated, were discovered. Therefore, additional criteria were developed to increase the accuracy of the model. Table 3 shows the additional criteria for detecting OWP buildings.
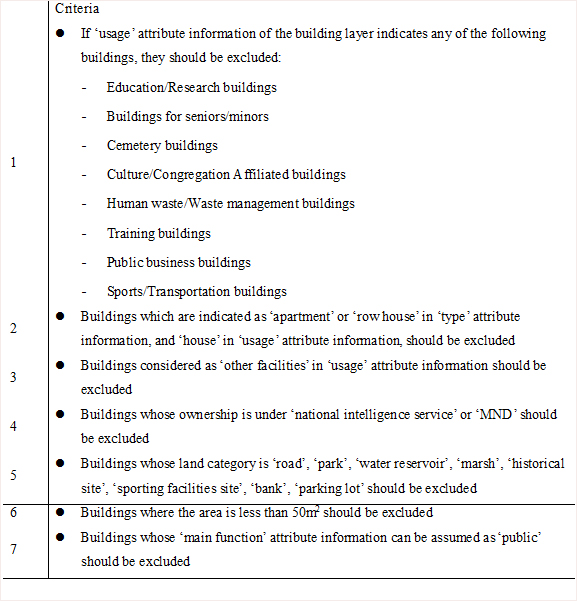
Among these criteria, numbers 1 to 3 are for excluding the NPOL parcels, in which many errors can occur when drawing OWP buildings. Number 4 is applied because there is very limited information of a building available if the building is under the ownership of these organizations. Number 5 is set up because a building in these land categories is likely to be public. Number 6 is derived because there are so many buildings whose area is less than 50m2 and it is difficult to check every building during an audit. Finally, the last criterion is derived because a building which can be assumed to be public in the ‘main function’ attribute information of a building layer should be excluded. Numbers 1 to 6 are objective, while number 7 is subjective.
Vinyl greenhouses
In the case of vinyl greenhouses, land parcels which include dry paddies and rice paddies among the NPOL parcels in the documentarily-unused NPOL serial cadastral digital map were extracted, and the documentarily-unused dry paddy-rice paddy NPOL serial cadastral digital map was made.
However, while the building layer of the digital map could be directly used for detecting OWP buildings, related information in the case of vinyl greenhouses is very limited. So vinyl greenhouse information was made by applying the image segmentation and individual object extraction method to orthophoto images. Figure 4 shows one example obtained through the image segmentation and individual object extraction method.
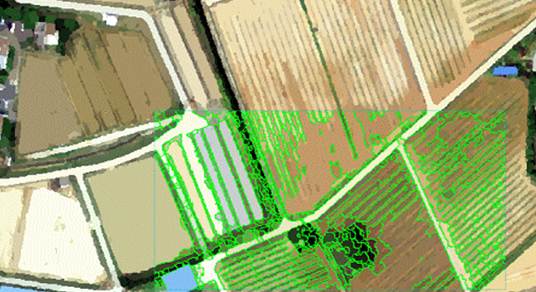
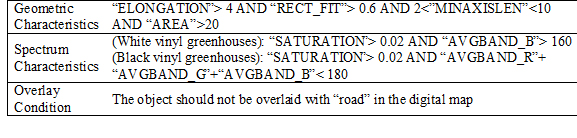
An image object extracted by the segmentation method is a group of pixels with similar spectral, spatial and texture attributes. Thus, the segmentation method divides whole images into image objects, which correspond to real-life entities (i.e. buildings, vinyl greenhouses, roads, etc.). By applying the criteria in Table 4, image objects corresponding to white or black vinyl greenhouses are distinguished from those corresponding to other real-life entities.
Notice:
ELONGATION: The measure of a shape that indicates the ratio of the major axis to the minor axis of the polygon. The major and minor axes are derived from an oriented bounding box containing the polygon.
RECT_FIT: The measure of a shape that indicates how well the shape is described by a rectangle. This attribute compares the area of the polygon to the area of the oriented bounding box enclosing the polygon.
MINAXISLEN: The length of the minor axis of an oriented bounding box enclosing the polygon (m).
AREA: The area of the polygon (m2).
SATURATION: The average color intensity value of the pixels. When color is fully saturated, the color is considered in its truest version.
AVGBAND_R(G, B): Mean value of the pixel values comprising the region in a red(Green, Blue) band.
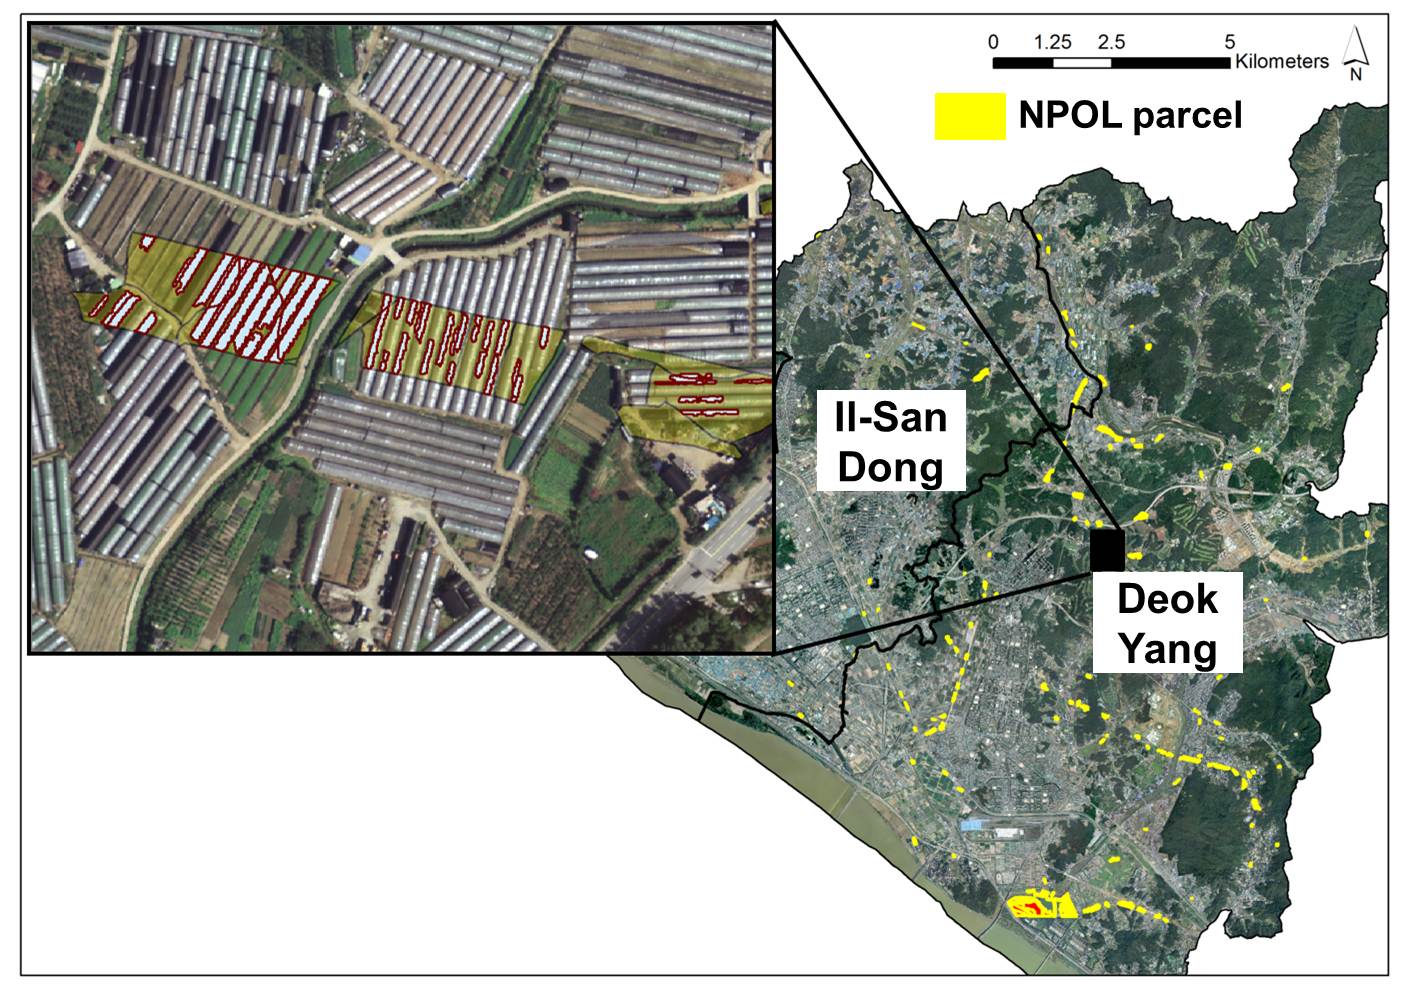
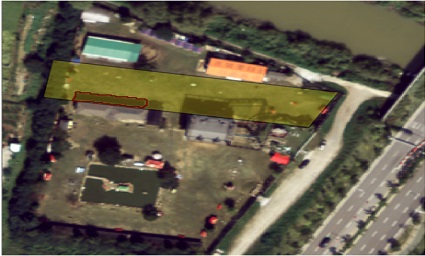
Then, these vinyl greenhouse objects were overlaid with documentarily-unused dry paddy · rice paddy NPOL cadastral digital map to detect the OWP vinyl greenhouses. Figure 5 shows one example of applying the criterion in Table 4 to Goyang.
However, when applying the above algorithm, a problem occurs where other objects are also occasionally extracted. That is, the shadow of building in the orthophoto image is also extracted, as it sometimes has the same geometric spectrum characteristics as black vinyl greenhouses. Figure 6 shows an example where the shadow of building is extracted.
Results
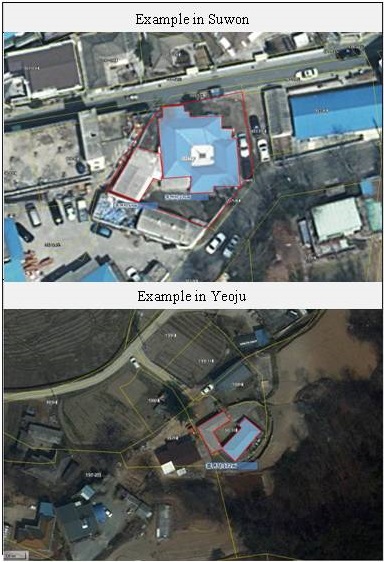
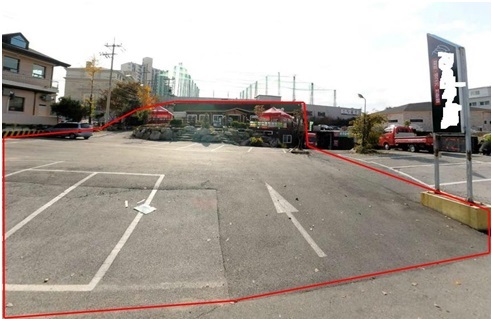
As shown in Table 5, the total number of NPOL parcels at which OWP building is assumed to be located is 536. Figure 7 shows two examples of OWP buildings in Suwon and Yeoju.

Notice:
While ‘total’ refers to the sum of the three cities in ‘Number of NPOL parcels’, in the case of ‘Average area of NPOL parcel’ and ‘Average price of IPNPL, ‘total’ refers to the average of the three cities.
With 207 NPOL parcels being extracted for vinyl greenhouses, there were 142 cases where vinyl greenhouses did exist, demonstrating an estimated 70 percent accuracy.
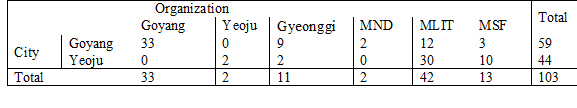
Table 6 shows the results based on the organization. There are 59 NPOL parcels correctly extracted in Goyang and 44 NPOL parcels in Yeoju, while there were none extracted in Suwon. And although 39 NPOL parcels were correctly detected, those NPOL parcels are not included in Table 6, as it was not possible to collect information on the ownership of the NPOL parcels.
It is a basic precondition that the CAAT should be developed with sufficient accuracy. Therefore, this research verifies the accuracy of the developed model by requesting the local government officials to verify the model’s accuracy, as mentioned earlier.
For testing accuracy, 20 NPOL parcels, which are building sites, are selected from each city and local government officials visited each NPOL parcel to confirm the OWP buildings’ existence. Based on the field tests, 58 OWP buildings for 60 NPOL parcels existed, showing a 97 percent accuracy rate.
Figure 8 shows one example found in Goyang.
Conclusions
It is shown that GIS can be a useful tool to detect OWP buildings and vinyl greenhouses by using spatial information of real life structures, along with the administration data related to the NPOL parcel in a more comprehensive and systematic approach. This research may have the following limitations: 15,509 NPOL parcels are excluded in this research, as there is a difference in the information between the serial cadastral digital map and the management register; and it is not possible for us to assure that the extracted 536 NPOL parcels have all the problems of OWP, although it is confirmed that the model shows a high level of accuracy based on field tests for the 60 NPOL parcels.